Rising Debt: Its Effect
by Alex Saitta
June 30, 2019
Debt:
I have long written the rising debt levels in our country beit at the government, corporate and individual level are a problem. One day, it will all blow up on us, but until then there are other resulting problems already creeping in as you can see in this chart.
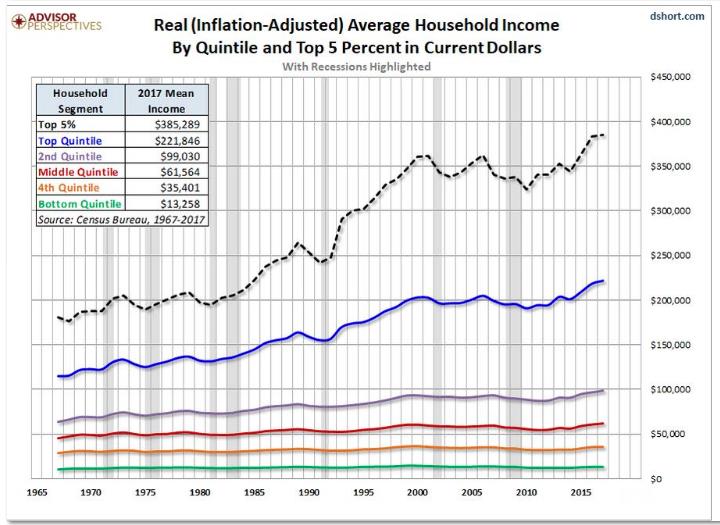
This chart plots real income divided by five the 20% sections of households, from about 1965 to the present. The bottom 20% of households with the lowest income are in green. The next highest 20% is in orange. The next highest 20% in is in red, the next 20% in gray, and the top 20% of households in terms of real income is in blue. There is an extra line, dashed, plotting the real income of the top 5% of households.
Real Income:
Real income is nominal income that is adjusted for inflation. It is a good proxy for true purchasing power. For instance, if Mr. Jones’ household income is $100,000, and this year his income grows by 5%, but inflation is 2%, his real income will rise to $103,000. As individuals, corporations and the government is devoting more of its income to paying interest, there is less to invest and consume. The former slow productivity, GDP and income growth while the later erodes the standard of living. Those at the bottom, with the lowest growth in wages, inflation rate hits them the hardest and naturally their real income growth gets hurt the most. Those at the top who have extra income and invest in high earning assets like stocks and real estate, typically see the highest growth in real income.
The Rosy Numbers:
As you can see, the bottom 20% of income earners (green line) have not had real income growth in about 25 years. Those in the next 20% (orange) and the 20% (red) above that, have not had real income growth in about 15 years. The next 20% and the top 20% of households recently went to new highs in terms of real income growth. These are the real income numbers that use the stated inflation rate, now about 2%.
Real Numbers:
The official government inflation rate was dumbed down back in 1990. The true inflation rate, calculated using the 1990’s formula is running about 4 to 5% and has been awhile. If we used that to calculate real income levels, the bottom 60% has seen a decline in real income or their purchasing power over the past 15 years to 25 years. Folks our rising debt levels are weighing on us, and the economy is rotting from the bottom up.
Home Write-ups Videos About Us Contact Us