Borrow, Print... Inflation
By Alex Saitta
August 20, 2024
Introduction:
If you read my old website, some of my letters to the editor and columns here, you know I have long talked about the evils of debt. It has taken time, but we are starting to see the consequences of the piles of debt at the government, corporate and consumer levels.
I first wrote about the coming debt crisis in June 2005. We had a debt crisis in September 2008. The economy nearly collapsed again in March 2020. What saved us then is the government has gotten better at managing the debt and these shocks to the system. I misjudged and greatly underestimated all that. But things are getting worse and have accelerated.
How They Do It:
Mainly, the Federal Reserve buys up public and private debt with printed money like a Banana Republic. (Debt is a problem, just wipe it out with printed money is their solution.)
I thought by now investors would have seen through this shell game, but I was wrong about that too. They just keep lending money to the US Treasury at artificially low interest rates. While this monetization of debt has kept interest rates from rising too much and collapsing the economy, all the printing of money is causing inflation to rise faster than incomes, making things unaffordable for many.
True Inflation:
Don't believe the Consumer Price Index. It was watered down in 1980 and again in 1990, so it way understates the true inflation rate. You have often seen this slide which shows prices have risen 17% the past 3 years. Nope. As I said, according to the 1990 CPI measure (a more accurate gauge of inflation) prices rose about 30% over that time.
That is not hard to prove. Just pull out receipts from 3 years ago like I did today. I regularly buy these same exact items at the same place for my rental business. Up an average of 28% the past 3 years.
Housing Is Worse:
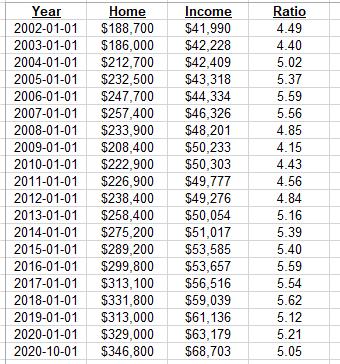
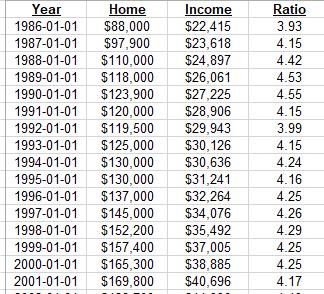
My point that inflation is higher than stated and prices are rising faster than income due to all this debt and money printing is no clearer than when you look at home prices.
In 1969 the median household income was $9,400. The median price of a home was $24,800 or 2.6 times income. By 1986 household income was $22,415 and a home cost $88,000 or 3.93 times income. That ratio was quite stable until 2001 where it was only 4.17 times (see item 4). During that time, the printing of money was mild.
The recession of 2001 ushered in a period of lots of money printing. It then got worse. The Fed created 5 times the bank reserves in the 2009 to 2013 period as it had it first 95 years of existence. Inflation rose.
From 2020 through 2022 the Fed printing press was running wide open again, with the Fed buying record amounts of Treasury bills, notes and bonds, and mortgages with printed money.
In 2022 median household income was $74,580. The median price of a home was $442,600 or 6 times as much.
Conclusion:
I know I sound like a broken record, saying this over a decade now. This will continue to get worse as annual deficits are running at $2 trillion a year. If you are not invested in things that are keeping pace with inflation like real estate gold/ commodities or stocks, you will be left further behind as your income from your job will continue to buy less and less over time.
I abandoned stocks totally in August of 2019 when the Dow was at 26,000 (a mistake). I have been and continue to be very defensive, worried and adverse to investment risk. I have stayed in real estate and precious metals and mainly because of the former, I have kept pace with inflation.


